
Cilandak
2,171 companies · District · code 31.74.06
Map
Large markers count companies; small ones are the places listed further down.
Sub-district
Schools & education in Cilandak
This is not company registration data — for a place we hold only its name and its point, so the link goes to the map.
Nearest to the centre of Cilandak, within 6 km
- MTs Raudlatul Ilmiyah · 400 m · Jl. KH. Muhasyim IV No.12 No. 7i, RT.11/RW.6
- Wacana Tata Akademika · 550 m · Jalan Gereja 51
- SDN Cilandak Barat 04 Pagi · 600 m · Jl. BNI Raya 46 No.35 4, RT.4/RW.5

Shops & markets in Cilandak
Nearest to the centre of Cilandak, within 6 km
- Indomaret Plus · 450 m · 5, Jl. RS. Fatmawati Raya No.35, RT.5/RW.4
- Primo Supermarket · 600 m · Town Square, Jl. TB Simatupang No.KAV.17 Lantai Dasar, RT.6/RW.9
- Pasar Mede · 700 m · Jl. R.S. Fatmawati Raya, RT.2/RW.5

Health in Cilandak
Nearest to the centre of Cilandak, within 6 km
- V Medical & Aesthetic Clinic · 200 m · Jl. R.A. Kartini Gedung Ventura No.26, RT.10/RW.4
- Rumah Sakit Ketergantungan Obat · 250 m · Jalan RS Fatmawati
- Rumah Sakit Fatmawati Unit IGD · 350 m · Rsup Fatmawati, Jl. RS. Fatmawati Raya No.4 No. 74, RT.4/RW.9
Dengue, typhoid, malaria and chikungunya are insurable risks.

Food & coffee in Cilandak
Nearest to the centre of Cilandak, within 6 km
- Kopka.JKT · 100 m · Jl Banjarsari 1 no 14. Ring Road, Jl. R.A. Kartini, RT.1/RW.8
- NENG SUMI · 150 m · Jalan Taman Cilandak 3 1
- F/5 Coffee · 150 m · Jalan Taman Cilandak Raya F/5

Recreation & sport in Cilandak
Nearest to the centre of Cilandak, within 6 km
- Pantai Palampang · 300 m
- Indonesia Motorsports Heritage Museum · 450 m · Jl. Lebak Bulus I No.7a 4, RT.4/RW.4
- 121fitnessjapan · 750 m
Tickets for attractions, tours and activities — booked before you go.

Transport in Cilandak
Nearest to the centre of Cilandak, within 6 km
- Pool Lorena-Karina RA Kartini · 650 m · Jalan Raden Ajeng Kartini
- Ryanta Mitra Karina · 750 m · Jl.R.A Kartini No. 16
- Agen Bus Sinar Jaya Lebak Bulus · 1 km · Jalan Lebak Bulus III 8
Train, bus and plane tickets, booked on the provider’s own site.

Everyday services in Cilandak
Nearest to the centre of Cilandak, within 6 km
- SPBU Cipete · close by · Jalan TB. Simatupang
- Bank Mandiri KCP Jakarta Cilandak Barat · 250 m · 1, Jl. RS. Fatmawati Raya No.6, RT.1/RW.4
- BRI Fatmawati · 300 m · Jalan RS Fatmawati 37

Property market in Cilandak
Houses, apartments and land in Cilandak
Monthly rentals and co-living, run by the operator itself, in the cities it covers.
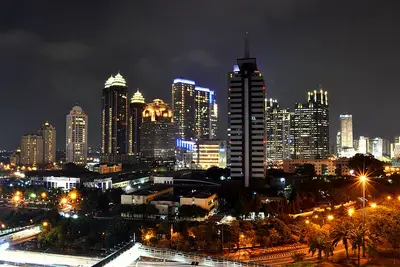
Area figures for Jakarta Selatan
Official figures for Jakarta Selatan, the area this place sits in
Each figure carries the year it was measured; figures published only per province are shown separately below.
-
Population
2,207,857
people · 2026
2020–2026: from 2,226,812 to 2,207,857 -
HDI (Human Development Index)
86.94
2024
prov. 83.08
2010–2024: from 80.26 to 86.94 -
Poverty (Population below the poverty line)
3.23%
2025
prov. 4.28%
2010–2025: from 3.81% to 3.23% -
Unemployment (Open unemployment rate)
5.09%
2025
prov. 6.05%
2017–2025: from 6.87% to 5.09% -
GRDP (Gross regional domestic product)
Rp908 trillion
2025
2010–2025: from Rp241 trillion to Rp908 trillion
Further components
- Life expectancy
- 75 years 2024 · prov. 73.9
- Mean years of schooling
- 12.1 years 2025 · prov. 11.6
- Expected years of schooling
- 14.3 years 2025 · prov. 13.8
- Expenditure per capita
- Rp26.4 million per person per year 2025 · prov. Rp20.7 million
- People below the poverty line
- 75,660 people 2025
- Poverty line
- Rp959,133 per person per month 2025 · prov. Rp852,768
- Population aged 60 and over
- 12.55% 2025 · prov. 12.01%
Province level: Jakarta
These three figures are published only per province.
- GRDP per capita (Gross regional domestic product per capita)
- Rp368 million per person per year 2025
- Provincial minimum wage
- Rp4.28 million per month 2020 · the most recent figure available
- Population density
- 15,978 people/km² 2021 · the most recent figure available
Recorded crime in Jakarta
Recorded across Polda Metro Jaya during 2024, which covers this place
- Offences reported
- 77,261 cases
- Cases cleared
- 30.18%
- Risk per 100,000 residents
- 316
Break-ins and theft are insurable risks. Insure your home

Recorded disasters in Jakarta Selatan
112 disaster events were recorded in Jakarta Selatan, the area this place sits in, during 2016–2025.
Counted from officially recorded events. An event spanning several districts is apportioned between them, so counts are rounded.
Kinds of disaster 2021–2025
of 68 events
- Flood 33 49%
- Settlement fire 17 25%
- Landslide 9 13%
- Extreme weather 9 13%
Recorded impact 2021–2025
- 32
- Deaths
- 1
- Missing
- 26
- Injured
- 60,404
- Affected & displaced
- 875
- Houses damaged
- 7,120
- Houses flooded
Flood can be insured as an extension of a home policy. Insure your home
- 2016: 19 events
- 2017: 6 events
- 2018: 8 events
- 2019: 3 events
- 2020: 8 events
- 2021: 10 events
- 2022: 9 events
- 2023: 8 events
- 2024: 16 events
- 2025: 25 events
Business formation in Cilandak
198 businesses were recorded as founded in Cilandak during 2016–2025.
Counted from formations announced officially and held in our records — not every business that opened here.
Most common trades
of 628 companies with a classification
- Contractors & Construction 140 22%
- Technology & Software 90 14%
- Energy & Mining 70 11%
Legal forms
of 1,985 companies with a recorded legal form
- PT 1,366 69%
- CV 243 12%
- PT Perorangan 219 11%
- Yayasan 87 4%
- 2016: 0 formations
- 2017: 2 formations
- 2018: 1 formations
- 2019: 9 formations
- 2020: 2 formations
- 2021: 1 formations
- 2022: 2 formations
- 2023: 5 formations
- 2024: 12 formations
- 2025: 164 formations
Companies here (2171)
Showing 901–910 of 2171The Ceo Building Lt 12, Jl Tb Simatupang No 18 C RT. 006/RW. 006, Cilandak Barat
Mula By Galeria Jakarta, Cilandak Town Square, Jl. T.B. Simatupang Kav. 17, Cilandak Barat