
Lampung
9,185 companies · Province · code 18
Map
City/Regency
Property market in Lampung
Houses, apartments and land in Lampung
Monthly rentals and co-living, run by the operator itself, in the cities it covers.
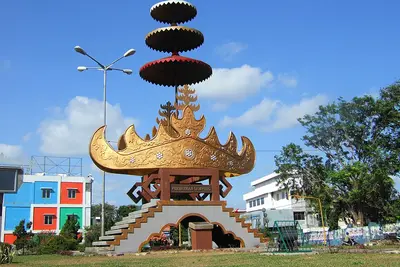
Area figures for Lampung
Official figures for Lampung
Each figure carries the year it was measured; figures published only per province are shown separately below.
-
Population
9,623,792
people · 2026
2020–2026: from 9,007,848 to 9,623,792 -
HDI (Human Development Index)
71.81
2024
2010–2024: from 63.71 to 71.81 -
Poverty (Population below the poverty line)
10%
2025
2010–2025: from 17.76% to 10% -
Unemployment (Open unemployment rate)
4.21%
2025
2017–2025: from 4.32% to 4.21%
Further components
- Life expectancy
- 71.5 years 2024
- Mean years of schooling
- 8.6 years 2025
- Expected years of schooling
- 12.8 years 2025
- Expenditure per capita
- Rp11.7 million per person per year 2025
- People below the poverty line
- 887,020 people 2025
- Poverty line
- Rp612,451 per person per month 2025
- Population aged 60 and over
- 11.39% 2025
- GRDP per capita (Gross regional domestic product per capita)
- Rp55 million per person per year 2025
- Provincial minimum wage
- Rp2.43 million per month 2020 · the most recent figure available
- Population density
- 262 people/km² 2021 · the most recent figure available
Recorded crime in Lampung
Recorded across Polda Lampung during 2024
- Offences reported
- 16,249 cases
- Cases cleared
- 60.56%
- Risk per 100,000 residents
- 186
Break-ins and theft are insurable risks. Insure your home

Recorded disasters in Lampung
589 disaster events were recorded across the districts of Lampung during 2016–2025.
Counted from officially recorded events. An event spanning several districts is apportioned between them, so counts are rounded.
Kinds of disaster 2021–2025
of 435 events
- Flood 216 50%
- Extreme weather 164 38%
- Forest & land fire 35 8%
- Landslide 18 4%
- Drought 2 0%
- Earthquake 1 0%
Recorded impact 2021–2025
- 35
- Deaths
- 8
- Missing
- 18
- Injured
- 454,761
- Affected & displaced
- 8,293
- Houses damaged
- 117,397
- Houses flooded
Flood can be insured as an extension of a home policy. Insure your home
- 2016: 18 events
- 2017: 9 events
- 2018: 33 events
- 2019: 50 events
- 2020: 43 events
- 2021: 76 events
- 2022: 71 events
- 2023: 74 events
- 2024: 60 events
- 2025: 155 events
Business formation in Lampung
1,507 businesses were recorded as founded in Lampung during 2016–2025.
Counted from formations announced officially and held in our records — not every business that opened here.
Most common trades
of 4,960 companies with a classification
- Contractors & Construction 3,285 66%
- Food & Beverage Manufacturing 643 13%
- Manufacturing 400 8%
- Schools & Formal Education 205 4%
- Banks 133 3%
Legal forms
of 2,615 companies with a recorded legal form
- PT 1,734 66%
- Yayasan 472 18%
- CV 293 11%
- PT Perorangan 60 2%
- 2016: 19 formations
- 2017: 24 formations
- 2018: 50 formations
- 2019: 151 formations
- 2020: 234 formations
- 2021: 243 formations
- 2022: 232 formations
- 2023: 172 formations
- 2024: 188 formations
- 2025: 194 formations
Companies here (9185)
Showing 91–100 of 9185Jl. HM. Ghardi, RT 003 RW 003, Desa/Kelurahan Ambarawa, Kec. Ambarawa, Kab. Pringsewu
Jl. Timor II Gg. Musholah RT. 05 LK. II KP. Sinar Baru, Kelurahan Kuripan, Kecamatan Teluk Betung Barat, Kota Bandar Lampung
Perum Bukit Alam Permai G3, Rajabasa Nunyai, Kec.Rajabasa, Kota Bandar Lampung
Dusun 3 Rt 014 Rw 006, Desa/Kelurahan Taman Asri, Kec. Purbolinggo, Kab. Lampung Timur
Jl. Raya danau, Pringombo Lk 5, Rt02, Rw 05, Pringsewu Timur, Pringsewu, Kab. Pringsewu
JL GAGAK NO. 46, Desa/Kelurahan Pinang Jaya, Kec. Kemiling, Kota Bandar Lampung
Dusun Trans PramTimur RT 016 RW 005 Kelurahan Raja Basa Lama Dua, kecamatan Labuhan Ratu, Kab. Lampung Timur